
I was expecting these to be uploaded weeks ago, but since no one has taken the time I have given it a shot. I am not good with a camera’s, internet or this forum but it is a fair shot.
The test is made by the Norwegian outdoor magazine FriFlyt. This is the first test I have seen which is both objective (technical) and subjective (test riders) of testing skis. I have only uploaded the technical part, as many other magazines have similar subjective tests.
They write in the introduction that they are fully aware that the different length of the skis, the style of the skier, and speed has an influence on the flex, but this test was made at a work bench (laboratory), so should be as objective as possible.
In addition they have calculated/ measured the length both total and surface, the square cm of the ski surface, and turning radius. ( not uploaded).
The flex is measured by weighting the ski every 10cm and then measure the flex from neutral.
Unfortunately, it isn’t stated anywhere if it is possible to compare across figures or if the flex can only be compared within the same graph.
How to read the graphs: (or my interpretation)
X-axis: “Midtpunkt”: is the middle of the ski. The length is shown in %, to show where the ski bent, both front and back.
Y-axis: the amount the ski flex, it isn’t scaled so hard to tell, and therefore impossible to say if it is possible to compare different graphs (subcategories) of skis.
Broken line: “Gjennomsnitt” is the average, with in the subcategory.
I thought the pictures was in larger versions, but don't know why they are so small??- feedback, Help!!
This is the fat ski subcategory:
The next two graphs are actually one, has been splitted to make it easier to read:
Every day skis:
This is girl skis:

Results 1 to 25 of 79
Thread: Ski comparison graphs.
-
11-25-2006, 12:31 PM #1
 Registered User
- Join Date
- Aug 2006
- Location
- In my dreams
- Posts
- 21
Ski comparison graphs.
Last edited by Ordinary Hero; 11-25-2006 at 12:37 PM.
-
11-25-2006, 12:36 PM #2
 Banned
- Join Date
- Feb 2004
- Location
- 121 msl
- Posts
- 2,580
Is there any way you could scan those pages?
-
11-25-2006, 12:40 PM #3
Registered User
- Join Date
- Aug 2006
- Location
- In my dreams
- Posts
- 21
I don't have access to a scanner.... But have the pic's in larger version, so if someone can upload them, I don't mind emailing them...
-
11-25-2006, 12:51 PM #4
Registered User
- Join Date
- Aug 2006
- Location
- In my dreams
- Posts
- 21
deleted the other thread. Forgot to copy the link to skibuilders.com, could it please be uploaded again -sorry
-
11-25-2006, 01:42 PM #5
ludovicorist
- Join Date
- Jan 2006
- Location
- bavaria, it's near germany
- Posts
- 206
here's the link again:
http://www.skibuilders.com/phpBB2/viewtopic.php?t=407This is how you talk when you learn English from pornos.
-
11-25-2006, 07:33 PM #6
 ________________
- Join Date
- Jul 2005
- Location
- Boulder
- Posts
- 6,190
Pretty sweet idea, thanks for uploading
The top graph is saying that almost everything is stiffer than the big daddy, except for the Sumo.
I'm fairly certain this is not the case...especially with regards to the maiden
-
11-26-2006, 12:13 AM #7
 Registered User
- Join Date
- Oct 2004
- Location
- Whistler
- Posts
- 554
 Originally Posted by XtrPickels

i believe the graph is referencing flex.... meaning all the skis are softer than the big daddy.... cep for the Goode Carbon 115, not the Sumo...
-
11-26-2006, 10:01 AM #8
 I drink your milkshake
- Join Date
- Oct 2003
- Posts
- 1,787
That would mean the t@nker and the titan pro are softer than anything else in that category. That would also mean all these skis are stiffest in the tips and tails. Originally Posted by couloir
If you read the thread, y axis is supposed to be for "stiffness", which would imply that the higher the value the stiffer the ski. Right? Such an interpretation also makes more sense since the graph is supposed to communicate flex characteristics... most skis get stiffer in the middle.
I sort of think that the real intent of the graph is for flex characteristics, and not to communicate relative stiffness. Otherwise the graphs don't seem to make any frickin sense when compared with what we already know about these skis. (i.e. b-squad is stiff throughout, whereas the t@nkers are stiff underfoot with relatively soft tips and tails.)Last edited by focus; 11-26-2006 at 10:17 AM.
-
11-26-2006, 10:51 AM #9
 motorboats titties
- Join Date
- Feb 2005
- Location
- north by northwest
- Posts
- 9,456
focus is right: the higher the graph the stiffer the ski for that particular displacement off the center. i have a pair of elan m02's in the shack. they have a metal plate in the middle which makes them very stiff just under the foot, but the flex softens up significantly the more you go towards the tips. this matches exactly the graph.
higher res pictures:


-
11-29-2006, 09:40 PM #10
Registered User
- Join Date
- Feb 2006
- Location
- Oakland, CA
- Posts
- 554
Oh for god's sake. Why don't YOU read the thread? The OP says (and we pretty much have to take his word for it) that they're testing for amount of flex, not amount of stiffness. They're opposite concepts. He never even mentions the word "stiffness". This is a test for displacement from neutral, i.e flex. Originally Posted by focus
This is confirmed when OP describes their methodology. They measure the ski unweighted i.e. neutral. Then they weight the ski and measure displacement (vertical travel) from neutral. Then they move the weight 10cm and again measure displacement from neutral. And again. And again. All those 10cm increments, and their corresponding displacements, are noted on the x-axis of the graph. That IS the graph. That's all it is.
No again. The graph goes up in the middle not because skis are stiff in the middle but b/c the skis are showing the greatest displacement at dead center because thats where the weight is farthest from the fucking fulcrums placed at either end--that's all. In fact, the skis that are super-stiff in the middle, like the Elan, show a flat spot on the graph. In other words, unlike many other skis they displaced almost the same whether the weight was dead center, or 10cm from ctr, or 20 cm from ctr. The flat spot showed that it flexed the same across this whole zone--which is not very much, hence the flat spot. If this was measuring increased stiffness, you would have the opposite graph result. Originally Posted by focus
Think about it: If you set a ski on two sawhorses, and put a weight at the center, you see a big bending action i.e. a big displacement i.e. a big # to measure i.e. a big spike on the graph. If you put that same weight near the tip, you don't see any of that. Certainly you won't see much displacement near the weight itself, and the closer you get to the tip/tail, the less you'll see any displacement even when you measure at the center. That explains the graph. Get it? Movement; that's all this test is measuring. Don't try and make it more than it is.
Sorry to be a cock, but this was just wrong in so many ways...
Okay, I'm over it.
-
11-29-2006, 09:46 PM #11
 Livin' the Moontime
- Join Date
- Sep 2004
- Location
- WYO
- Posts
- 9,707
Looks like Atomic and Scott have the smoothest flex throughout the ski. I don't know if that is an advantage or not.
-
01-09-2007, 09:55 AM #12
 Certified Fresh
- Join Date
- Feb 2005
- Location
- Oaksterdam
- Posts
- 1,402
HAHA Worked, and so necessary this was getting hella confusing. Thanks bro. Originally Posted by ShawnB
-
01-09-2007, 10:28 AM #13
 Registered User
- Join Date
- Feb 2006
- Location
- Skiattle
- Posts
- 7,750
those graphs are fairly confusing.
it is possible to get a feeling for the stiffness of each ski by looking at the slope of the curves. The steeper the slope, the stiffer the ski. Toward the midpoint of each ski, this qualitative analysis method isnt too great as the exponential factors in beam stiffness start to take over a bit, or at least I think so. Furthermore, the midpoint would be drastically effected by different lengths of skis.
Those graphs would be infinitely more useful if they had units on both axes, as well as the amount of weight placed at each interval. From that you could then get a better idea for stiffness. For reference, stiffness is measured in a force / displacement. This graph shows a displacement vs displacement. The slope can be used because the weight was supposedly held constant.
this trend doesnt seem to hold true for all skis, so maybe theres something else going on Im overlooking.
The volkl sumo curve is crazy to have that weird valley near the midfoot.Last edited by pechelman; 01-09-2007 at 10:31 AM.
-
01-09-2007, 10:57 AM #14
 Ski Mafioso
- Join Date
- Dec 2006
- Location
- In bed with the goomah...
- Posts
- 418
I've read all this thread, including ShawnB's explanation. He says this chart doesn't measure stiffness, but the opposite: flexibility or amount of flex (whatever you want to call it).
Still, I may be a damn fool.
In the everyday ski chart, the Volkl Mantra line is lower than the Dynastar Legend Pro Rider.
Does this mean the LP is "more flexible" than the Mantra? Can't be.
To me, more flexible means less stiff.
Again, I may be a damn fool.Last edited by Tony; 01-09-2007 at 10:59 AM.
-
01-09-2007, 11:05 AM #15
Registered User
- Join Date
- Feb 2006
- Location
- Skiattle
- Posts
- 7,750
i think its because the graphs are incomplete
assuming theyre the same stiffness, which will bend more, a 177 mantra or a 191 mantra with the weights in the middle? (the 191 if you didnt know)
so now what happens if they compared a 168 mantra to a 194 legend pro? that would potentially make the mantra flex less than the LP. If they normalized this data to the length, maybe then it would be a bit more clear.
The big issue here, is that these displacements are not normalized into a percentage. This is the reason engineers and materials are specified to have a % strain to failure, known as e, epsilon. The graphs are fairly worthless, but if you look at the slopes of the mantra and the LP, it looks like the LP has a bit steeper slope, and thus is the stiffer ski. On that same note, it looks like the tanker and titan pro are stiffer based on their slopes.
but like i said, some of the skis dont fall into this relationship, or maybe ive got the wrong impression about some skis. I still think theres somethign im overlooking as something doesnt seem to quite make sense.
-
01-09-2007, 11:12 AM #16
 Registered User
- Join Date
- Apr 2003
- Location
- Mammoth Lakes
- Posts
- 3,682
Keep the debate coming because I'm not sold on what this thing really is saying...
Also, can someone post a higher res picture of the everyday skis.He who has the most fun wins!
-
01-09-2007, 11:12 AM #17
Ski Mafioso
- Join Date
- Dec 2006
- Location
- In bed with the goomah...
- Posts
- 418
I've looked it up and "Stivhet" means stiffness in norwegian. Originally Posted by Ordinary Hero
So it seems that the y-axis is not the amount of flex (as the OP indicated) but the opposite, the amount of stiffness.
Now everything makes sense.
And yes, everything seems to be stiffer than the Big Daddy but the Goode.
-
01-09-2007, 11:16 AM #18
Registered User
- Join Date
- Apr 2003
- Location
- Mammoth Lakes
- Posts
- 3,682
Originally Posted by Tony
This jives with my own personal experience with many of those skis...He who has the most fun wins!
-
01-09-2007, 11:29 AM #19
Registered User
- Join Date
- Feb 2006
- Location
- Skiattle
- Posts
- 7,750
hmm Originally Posted by Tony
good point there with the translation
i think its important to realize that the y-axis is centered around the midpoint and not at the end of one ski. This makes sense because the peak stiffnesses are at the midpoint. Im curious as to how they fixtured the skis now.
-
01-09-2007, 11:35 AM #20
Ski Mafioso
- Join Date
- Dec 2006
- Location
- In bed with the goomah...
- Posts
- 418
Exactly, I think this solves the puzzle. So my interpretation is: Originally Posted by pechelman
- The higher the curve the stiffest and the lowest the curve the more flexible.
- The flattest the top of the curve, the more the stiffness is even throughout the ski (even flex).
- The pointier the top of the curve, the more the stiffness is concentrated in the midpoint (softer tips/tails).
-
01-09-2007, 11:43 AM #21
Registered User
- Join Date
- Feb 2006
- Location
- Skiattle
- Posts
- 7,750
AH!
ok
so i actually found that link above and read what the guy did to make those graphs.
100% certain they are stiffness as he describes
I beleive things look weird, and skis are not as where expected, because his method ignore camber. Which in some aspects is good, because it truly tests the ski's beam properties, but is bad, because its not real world.
If you ignore the camber, you also ignore the amount of preload needed to flex a ski to make contact with the snow, and then flex it even more to bend it when flexing the sidecut.
read through the posts of some dude named endre. should all be clear.
for those of you who ride fs bikes or understand damper\spring setup.
a spring will always be a certain spring rate, but when you turn down on the preload adjuster, camber for skis, you know how more force to overcome to initiate damper travel, or flex the skis. The spring rate, however, remains unchanged, as does the actual properties of the ski iteself.Last edited by pechelman; 01-09-2007 at 11:46 AM.
-
01-09-2007, 06:50 PM #22
Registered User
- Join Date
- Feb 2006
- Location
- Oakland, CA
- Posts
- 554
Well this is a fine how-do-you-do. The plot thickens...
Okay, there's no way I'm gonna assert I was right if the chart really does say "stiffness" in Norwegian. That was apparently a misstatement by the OP., who I thought we had to trust since the info was all going to be in epic Norse verse. BUT, good on Pechelman for checking out that other thread and discovering that, lo and behold, it's in English. Problem solved.
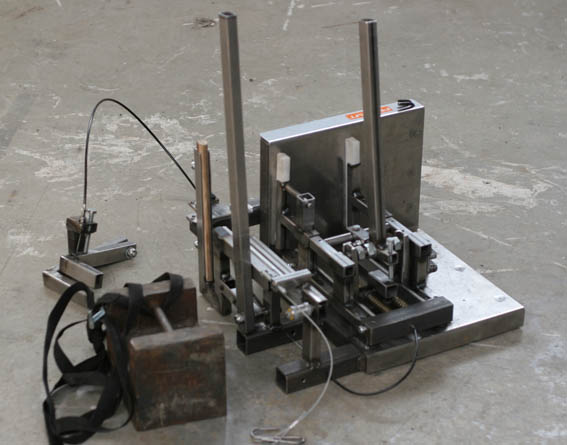
I totally agree w/ Pech that this Endre dude, who made the tests, was indeed testing for stiffness. He describes, to some extent, his real methodology on the other forum. He was NOT hanging weights as the OP said. He was NOT putting the skis on tip and tail stanchions and measuring for flex (or total displacement) as the OP implied. This is where it all went off the rails, due maybe to language issues or just bad assumptions; who knows?
Anyway, he built an apparatus--which was not mentioned before--that allowed him to bend the ski in little increments--by which he was able to compare the stiffness measured in one area to the stiffness measured in the next. Basically he put his device on just a section of the ski at a time, clamped it down and applied a 500-newton point load to the ski 10cm from the clamp. Then he measured the displacement out at that clamp-plus-10cm location. Then he unclamped everything, moved the ski 10cm, and did it all over again.
As Pechelman says, there are problems with this bit-by-bit method, mostly because it seems to ignore certain aspects of how a ski behaves--overcoming the preload of the camber is one big one; removing the bindings and pretending the ski is free to flex unencumbered is another one. There are a number of other issues that make this test less than a full picture of relevant issues in ski stiffness: A ski is never a true cantilever for instance, and it never flexes while fixed to any location. Nevertheless, these graphs would seem useful (if the f'n thangs were even calibrated ) to compare the pre-mounted, non-real-world, basic stiffness of one area of one ski to one area of another.
Unfortunately, we can't do that yet. But this guy's li'l test is a good start, on the bigger, and more helpful total project of representing ski flex behavior.
Again, I feel bad about the earlier rant. It was true, for what we knew and were being told at that point, buuut alas, those things didn't turn out to be the fact, so ultimately it's my bad... Thanks to Tony, Comish, and Pech for continuing the critical thinking.
-
01-11-2007, 12:07 PM #23
Ski Mafioso
- Join Date
- Dec 2006
- Location
- In bed with the goomah...
- Posts
- 418
Does anybody have a better resolution pic of the above graph? Originally Posted by Ordinary Hero
F2F maybe?
Thanks.
-
01-12-2007, 06:25 AM #24
Registered User
- Join Date
- Jan 2007
- Location
- Norway
- Posts
- 48
congratulations, you found the solution!
A very interesting thread to read, atleast for me. I did not know of this discussion until right now, thank's for letting me know Tony
Lots of nice input, and it is very nice to see that people appreciate the curves.
We started this project of testing real technical properties of skis last winter, and it is definately going to continue this season.
A lot of things to explain here, and many of them are allready explained in this skibuilders forum thread: http://www.skibuilders.com/phpBB2/vi...er=asc&start=0
The graphs are all compareable, the charts are the same, but our main problem is that putting all the curves in one chart will mess up the whole image, it is not room for more than 10-13 curves in one chart.
The x-value is, as you have allready found out, stiffness. The unit is N/mm, and a pretty standard way of describing stiffness.The little black lina on the middle of the x is 500 N/mm. Origo is 0N/mm. The y-axis is length both ways in cm. from center of the ski
Comment on the flex-camber-binding problem: When measuring skis I am absolutely confident that we can not mix different characteristics into one unit. Even if it is absolutely true that all the different characteristics infect on how the ski performs. A term of "stiffness combined with camber" would be absolutely useless, because you would not be able to separate the two values afterwards.
Say f.ex if you have a value of how much resistance a ski has when it is bent 100mm into the snow. If you compare a ski with 15mm camber with a ski with -10mm camber according to this method, you will not be able to tell how much resistance the ski will give at 200mm deflection.
It is the same problem with bindings, the binding affects the stiffness, but all bindings affect the stiffness differently. It is much better to make separate ski- and binding tests, and eventually combine these results. I am planning to make similar tests of how much a binding affects the stiffness of a ski.
About the BigD: Many (including myself) was surprised by BigD's curve. The ski seems to be much softer than it's reputation. As you can see from the diagram the ski is pretty soft in the middle, not so soft in the tips. I have not measured last year's BD, but it is probably a bit stiffer.
The problem with people's assumptions when manually flexing skis, is that you only feel the stiffness in the tips. When you flex a ski towards the floor, the tips get most of the deflection. this makes manually flexing a very unprecise way to measure flex. A ski like f.ex the Rossi Squad will feel extremely stiff, and the Stöckli Stormrider DP will feel extremely soft. The midski of the DP is stifer than the Squad.
We have had similar discussions about the characteristics of skis like the K2 Fujative in Norwegian forums, The ski is thaught to be a soft ski, but test show that the ski is very stiff underfoot and has a soft front tip. (this is allso correct according to K2's website) People seem to get very engaged, and sometimes a bit angry, when the reality does not match the myth.
The curves are correct, every ski is measured every 10cm all the way.
I really appreciate all input, the goal is to develope a way to discuss and visualize flex and other characteristics in an easily understandable way. It is very valuable to see how everyone understand the diagram.
I will upload more images of diagrams when I get time to do so. (totally I have measured 135 skis)
Here is an image of the flextester:
Endre Hals
Fri Flyt
-
01-12-2007, 10:23 AM #25
Ski Mafioso
- Join Date
- Dec 2006
- Location
- In bed with the goomah...
- Posts
- 418
Hi Endre,
I was going to PM with directions to this thread but it seems you easily find it yourself.
Keep up this excellent work as it is highly appreciated. IMO, this is sticky material.
Cheers.Last edited by Tony; 01-12-2007 at 10:26 AM.


 Reply With Quote
Similar Threads
-
Surfing/Skiing comparison
By Brocktoon in forum The Padded RoomReplies: 53Last Post: 05-06-2010, 12:55 PM -
Ski Comparison Tool
By markanite in forum General Ski / Snowboard DiscussionReplies: 42Last Post: 11-10-2006, 02:09 PM -
Feedback on Beacon Comparison Charts for Avy Courses
By Jonathan S. in forum The Slide ZoneReplies: 3Last Post: 10-19-2006, 04:41 AM -
In comparison
By Catbert in forum Tech TalkReplies: 2Last Post: 04-05-2006, 06:29 PM -
BRO Model Flex Comparison
By Storm11 in forum Tech TalkReplies: 8Last Post: 03-22-2006, 08:24 AM

Bookmarks