
I'm taking a GIS course this semester and I was thinking about producing a slide path map for maybe the Mt. Baker area, or another WA area for my semester project. I know NWAC would be a great resource to contact for data etc, and I also know of some professors at some of the universities in the PNW I could talk to, but do any of you know of any other sources for good data on slide paths around the Mt. Baker Ski Area, or shit for that matter maybe from just above Glacier to Shuksan?
Within GIS I can preform a slope analysis to see if there are any general trends in what angles these slides tend to trigger on, and additionally I can also look at what aspects tend to be the most prone to sliding as well. Futher, if the data are available I can also include in the digital file at least the temperature/ambient conditions that triggered the slide.
If anyone has any thoughts or resources that I might find useful for this project (other than NWAC) let me know. Thanks.
Results 1 to 25 of 40
-
01-07-2009, 09:46 PM #1

 MWHC
MWHC
- Join Date
- Nov 2008
- Location
- the hysterical town of George, CO
- Posts
- 1,676
Looking to produce slide path maps with GIS
the-one-track-mind Originally Posted by DoWork
-
01-07-2009, 10:15 PM #2
 Analyst
- Join Date
- Jul 2008
- Location
- Seattle
- Posts
- 639
Look at avalanchemapping.org ( if you haven't already ). WSDOT keeps some pretty old atlases around for slide paths that affect roads. I've never seen a backcountry avalanche atlas for the areas you describe. Microsoft Live Maps ( maps.live.com ) has very high resolution imagery available. ( Far better than Google Earth or Google Maps. ) You can examine the imagery for trim lines indicating avalanche paths and then check the terrain data for steepness. If you're skilled at reading terrain you can differentiate between bare patches and avalanche paths.
This method could work acceptably for determining starting zone and track but won't be very useful at all for determining maximum runout for large events. However with careful work you could determine the beta runout location and perhaps make some educated guesses about runout for maximum events. Not sure about your level of experience or knowledge, but for some mountain ranges a:b are proportional to some degree. Sometimes directly. You can use the alpha:beta ratio to determine a likely maximum runout. I'm not sure about the alpha:beta ratio for the Cascades. In fact I'm not even sure such a value has ever been calculated.
Anyway, not sure if it matters but I'd stear clear of the dynamics models for determining runout. The math behind dense, granular flows is not well understood.
-
01-07-2009, 10:33 PM #3
MWHC
- Join Date
- Nov 2008
- Location
- the hysterical town of George, CO
- Posts
- 1,676
I'm really not too experienced at all with avy/snow science knowledge. I mean I know some of the fundamental principles that govern the processes but beyond that I'm just a noob to the whole thing. I'm planning on moving out to WA though after I finish school and have plans to take avy certification training for sure. I feel pretty competent with my ability to read/interpret aerial imagery and if I'm in doubt the prof I'm working with on this should be able to help me out.
What's this alpha:beta ratio you're describing? I wasn't planning on using models to predict max runouts or anything, but the alpha:beta thing sounds like it would merit further investigation on my part for sure. In addition to the maps, I will be likely producing a paper, or at the very least a powerpoint presentation describing my research and results. And if the maps look good, I'm sure I could make them available to people on here if they were interested in them.
Thanks for the info, I appreciate it.the-one-track-mind Originally Posted by DoWork
-
01-08-2009, 02:40 AM #4
Analyst
- Join Date
- Jul 2008
- Location
- Seattle
- Posts
- 639
This may be unimportant for your project. A bit tired. My last post should really have discussed the "relationship" between alpha and beta angles instead of ratio.
An avalanche path has a starting zone, track, and runout. In theory, an avalanche atlas ( a map of slide paths ) should accurately map the starting zone, track, and runout ( along with other parameters such as aspect, elevation of starting zone, and a profile of the path ). Sometimes it's easy to determine the spatial boundaries of the starting zone, track, and runout zone. Sometimes it's very difficult.
If you want to make an avalanche atlas, you're faced with determining the spatial boundaries of the path, including maximum runout for large events that may have a very long return period. ( 1:100. This doesn't literally mean the avalanche returns every hundred years, it means the probability of the maximum event is expressed as 1 chance out of 100 for each year. )
In the past, dynamics models ( after Voellmy ) were used to try and figure out the maximum lower boundary of the path. However most of this work has been discounted. Modern avalanche dynamics models are focused more on granular flows. But forget about that for a moment.
Empirical, statistical methods are more popular these days, especially with the risk management aspect of avalanche hazard mapping. Anyway, the beta angle is the angle between the starting zone and the first ten degree slope in the runout zone. The alpha angle is angle between the furthest known runout distance and the starting zone. Finding the beta angle for any avalanche path is relatively easy. Simply find the first ten degree slope in the runout zone and measure the slope angle from that point ( following a straight line ) to the top of the starting zone.
So how do you determine alpha? It's much more difficult. Often field surveys are used in which vegetation is analysed and possibly the area around the runout zone is examined for damaged vegetation, pseudo-moraines, rocks embedded in trees or rocks found in other unusual places, and other signs of avalanche activity such as flow signatures in soil or on tree trunks. People have been known to take core samples from trees and look for reaction wood that indicates a tree was struck by an avalanche. Simple and complicated. Time consuming as well.
In some mountain ranges there is a relationship between the alpha and beta angles for many of the avalanche paths. I'm not sure that any such number has been determined for the Cascades. But ... If you know the beta angle, it is theoretically simple to use a regression equation to determine the alpha angle. Then you can find the maximum runout distance for large events. With this information in hand, you can create an accurate map of the avalanche path. You should look at Donna Delparte's paper: http://www.ucalgary.ca/asarc/publica...uthor/Delparte and the filename is: DelparteThesis_AvTerrainModelling.pdf. I'm sure you'll find her work quite fascinating.
There are other complications with constructing avalanche atlases. First and foremost, you have to understand terrain and geography fairly well because an avalanche path isn't necessarily simple. There are alpine paths, sub-alpine paths, channelized paths, and open paths. Sometimes avalanche paths have very nice trim lines and sometimes not. Starting zone and track are sometimes relatively easy to determine for sub-alpine paths. It just depends - starting zone geometry can be awfully complicated as well. Alpine avalanche paths often have no visible boundaries and can be very difficult to sort out.
Also keep in mind, avalanches aren't always neat confined by drainages, and dry flowing avalanches in particular often travel wherever the day takes them. Over ridges, over large obstacles, etc. The unpredictable behaviour of dry flowing avalanches sometimes makes the concept of an avalanche path a bit less important. It's very important to remember than an avalanche path only shows you where avalanches have run in the *past*. However, with avalanches, sometimes past behaviour is a good indicator of future behaviour, at least in some paths.
So for fun, you can remember that most avalanches do not run full path but an avalanche atlas should describe the full path.
Try this link for more information on avalanche atlases: http://www.wsdot.wa.gov/Research/Reports/000/008.8.htm
-
01-08-2009, 10:38 AM #5
MWHC
- Join Date
- Nov 2008
- Location
- the hysterical town of George, CO
- Posts
- 1,676
FKNA man, thanks for all of that. I knew the stuff about 100 year slide events already as far as them being based on the 1/100 probability from doing a lot of fluvial geomorphological work already, but a lot of this info is new for sure. Thanks again for the extra resources and input. I really appreciate it. I'll keep you posted as to what's going on as I move further into this endeavor. Today is only the 4th day of the semester, and our GIS course will have its second meeting tomorrow, but from the sounds of what you're saying I'm going to be working on this most of the semester and won't have any time to procrastinate if I want to do this well.
 the-one-track-mind Originally Posted by DoWork
-
01-08-2009, 11:10 AM #6
 guillotines
- Join Date
- Mar 2006
- Location
- in your second home, doing heroin
- Posts
- 14,674
Some good info CM.
My first instinct to get started would be talk to the Washington department of transportation. Those guys HAVE to know high risk areas that involve any of the roads, if if only plowed once a year in spring. Most of the guys I've talked to from the California dept know the zones where accidents have occurred, and probably have incidents recorded somewhere.
It would be an easy place to start and likely to be a good source of records.
And let's be honest. Most backcountry jaunts start by roads. Besides the comet that killed the dinosaurs nothing has destroyed a species faster than entitled white people.-ajp
-
01-08-2009, 11:44 AM #7
Analyst
- Join Date
- Jul 2008
- Location
- Seattle
- Posts
- 639
Happy to provide information. I hope your project goes smoothly and I'm interested to see your results. Kidwoo good suggestions as well ( and I love your upside down dog link ).
-
01-22-2009, 06:58 PM #8
Registered User
- Join Date
- Oct 2003
- Location
- CO
- Posts
- 570
The Utah GIS site has a slide paths shapefile that would save you from digitizing slide paths. One of the PNW states may have a similar layer.
If you end up digitizing, I would look for a hazard map from the USGS or state geo survey that you could scan and digi. That will give you better results then trying to use aerial imagery. If you end up using imagery, I'd recommend using digital ortho Quads, they have been rectified for optical/perspective distortion and will give you better results. (if you didn't already know that)
A project idea I have been throwing around was to build a slide path map that also included aspect/elevation info to correspond with an Avi Rose. I always thought this would be useful for planning objectives and alternatives.
I'm interested to hear what you end up doing, and seeing a product. Good Luck.
-E
-
01-22-2009, 07:24 PM #9
 Red sky at night...

- Join Date
- Dec 2006
- Location
- Boozebay Harba
- Posts
- 644
I did some around Colorado. I started with DEMs and converted to slopes, and highlighted the slopes that are in the range for starting zones. Then I overlayed those highlights over topo and orthophotos and looked where the paths auctually were. I didn't end up making a shapefile for each path, but just did highlights over a topo to show some kids at a local school where the potential was around that area.
Topos are a nice starting point instead of imagery, because it pretty clearly shows most slides with the cleared out swatches of trees, but they aren't usually as up to date as most image sets that are easy to get.
What software are you using?
-
01-23-2009, 07:12 PM #10
 still hiking & hucking
- Join Date
- Mar 2008
- Location
- the hole
- Posts
- 588
try the folks @ i.s.s.w. they came to jackson a couple of years ago and there goodie bags had a map that shown all the resort slide paths.really cool topo/shaded/color coded shit . i'll have to find it and post it.out
-
01-26-2009, 07:34 PM #11
MWHC
- Join Date
- Nov 2008
- Location
- the hysterical town of George, CO
- Posts
- 1,676
I'll be using ERSI's ArcMap v9.3. I'm really hoping to get my hands on some LIDAR data for this project, but I'm not holding my breath about that. We'll see though. I'm just kinda starting to do some digging right now as well for scholarly articles (via google scholar) to see what similar studies/attempts have been made. Originally Posted by Fenris

Thanks for the input everyone. Hopefully I can produce something that would be beneficial.the-one-track-mind Originally Posted by DoWork
-
01-26-2009, 08:09 PM #12
 Gapper Jong, M.D.
- Join Date
- Apr 2006
- Location
- Bravo Delta.
- Posts
- 6,127
I was going to suggest Donna's work. Always good stuff under Bruce's direction. Torsten Geldsetzer has done some good GIS avalanche work under Bruce, but I can't find a link to the modeling paper/project that I was thinking of. he did something very similar to what you are describing, and takes into account the convexity or concavity of the terrain in the now velocity and runout length calculations. Originally Posted by CookieMonster
Last edited by iscariot; 01-26-2009 at 08:14 PM.
Originally Posted by Socialist
-
01-26-2009, 09:46 PM #13
 Registered User
- Join Date
- Dec 2008
- Location
- PDX
- Posts
- 5,321
I think this might be the paper you're speaking of: Originally Posted by passholer
McCollister, C., K. Birkeland, K. Hansen, R. Aspinall, R. Comey. Exploring multi-scale spatial patterns in historical avalanche data, Jackson Hole Mountain Resort, Wyoming. Cold Reg. Sci. Tech. 37(3), 299-313. [Abstract] [Article]
You can find it here under the 2003 papers:
http://www.fsavalanche.com/Default.a...arentLinkId=40
You can find most of Bruce Jamieson's work from the University of Calgary here:
http://www.schulich.ucalgary.ca/asarc/publications
Happy reading!Last edited by stalefish3169; 01-26-2009 at 09:51 PM.
-
01-26-2009, 10:44 PM #14
Analyst
- Join Date
- Jul 2008
- Location
- Seattle
- Posts
- 639
For elevation imagery try http://seamless.usgs.gov/
You can download very high quality digital elevation model and ( sometimes ) imagery for a wide variety of areas from this web site. It's a bit tricky to use the site but everything is free.
-
01-27-2009, 05:01 PM #15
MWHC
- Join Date
- Nov 2008
- Location
- the hysterical town of George, CO
- Posts
- 1,676
Yeah, and I guess the USGS has digi ortho aerials for every quad in the country. Too bad most of them were probably taken during the summer time. That will make determining and interpreting slide paths much more difficult I'm sure. Its funny though, 'cause I really hadn't been considering grad school too much but this is definitely something I could get in to. Especially if field work means I have to spend time in the backcountry on my board...man that would be rough
")
I also think it would be pretty ambitious but definitely beneficial to create an av map database for the US. But that's a whole 'nother ball of wax. Bet there could be some grant money for something like that though. Especially under the new administration "restoring science to its rightful place."the-one-track-mind Originally Posted by DoWork
-
01-27-2009, 06:51 PM #16
 Session Cat
- Join Date
- Jan 2009
- Location
- 907
- Posts
- 16,637
I don't know how meaningful lidar and other methods would be to most end users. Sure, we all like to have the most comprehensive dataset, but the cost of flying lidar whenever the conditions are right for nattys to rip out is beyond the scope of any avi or snow science org.
The spotty avi stats from different sources presents a statistical challenge as well. Sure, include as many attributes as you can for each event, that's the great thing about the science of GIS - it can use the info we have to answer questions we won't even think to ask for years.
But don't expect it to be easy or cheap to collect data that can qualitatively aid snow science any time soon - here's just not enough data density out there yet. For a long time to come, it's gonna take a mastery of statistics to be able to extract meaningful data for the hard science.
Avi safety could be enhanced for the typical skier by having a basic topo map of slide zone extents and a greyscale or subtle color code to represent frequency. Linetype can be used to convey many particularities in weather that may precipitate a specific slide zone (ie wet storm, upside down storms, deep hoar, etc).
I would urge you to read Edward Tufte , "The Visual Display of Quantitative Information". It is a masterwork and contains much specific info that may make your life easier and your maps better from now on.
Buena SuertaLast edited by highangle; 01-27-2009 at 06:54 PM.
-
01-27-2009, 07:32 PM #17
Analyst
- Join Date
- Jul 2008
- Location
- Seattle
- Posts
- 639
Poor weather is often cited as the reason winter imagery is not collected. Is this believable? Who knows.
It is definitely easier to identify slide paths when they're full of snow. On the other hand, this won't necessarily tell you very much about maximum runouts. The main problem is record-keeping: North American recording keeping is well inside the return period for the largest events. Some records do go back to the time of AB Rogers, the exploration of the Yukon, and First Nations in Canada have some interesting cultural records of related avalanching ( but just in general ). The precedings of ISS 2004 contain a couple of interesting papers on indigenous cultures, including their knowledge of avoiding avalanches, and some ( rather melancholy ) poetry related to the subject.
As I mentioned earlier, it's also difficult to estimate runout distances for large, dry-flowing avalanches because their behaviour is highly unpredictable. This may or may not be relevant for your work. There is an interesting paper in the precedings for ISSW2008 that discusses avalanches affecting the Kitimat-Kemano powerline in British Columbia. I believe this paper discusses the use of dynamics models for estimating flow velocity. ( Although I've heard, more than once, that dynamics models rely on risky assumptions and/or have an uncomfortable element of black magic in their application. I don't use dynamics models or probability models so I really am not qualified to comment further. ) There is another paper in the precedings that discusses the RAMMS simulation software from Switzerland. You might find this interesting.
The other problem with finding money for a national atlas is the concept of "hazard". For obvious reasons, most avalanche paths pose no hazard because hazard only exists when people or facilities are exposed. Therefore, from a financial perspective, there really isn't any need for a comprehensive avalanche atlas for the entire country. Although I definitely think such a resource would be useful and fascinating. There would be some question about including alpine paths, which might be very difficult to map properly. The Kitimat paper shows you the general difficulty with respect to alpine paths.
You'd really have your work cut out maintaining this because at least a few new paths are created each season and the existing paths sometimes increase in size depending on the severity of avalanches during a given season. Some avalanche paths are quite good at devouring trees. Some interesting video here ( found in the Interior BC ski conditions thread: http://www.new.facebook.com/video/vi...1125132&ref=nf )
It's a really interesting subject. But you obviously know that!
-
01-27-2009, 08:14 PM #18
MWHC
- Join Date
- Nov 2008
- Location
- the hysterical town of George, CO
- Posts
- 1,676
Yeah, my prof and I have talked a bit about the "hazard" mapping approach. His experience with this was when he was working for the State of Oregon doing a bit of landslide mapping. The huge problem is of course, if you say that a "hazard" exists somewhere where someone already has a home and their insurance rates go up, are you then liable? What if you miss a slide path that then causes someone to loose property or worse, their life. So yeah, we've talked a little about some of the trickier issues surrounding this, but it is pretty wild stuff, and I like what highangle was saying about basically creating something that would help backcountry recreationalists better understand where potential danger lies via topo maps with paths mapped on them. In addition using symbology that can integrate weather conditions, snowpack obs for the event etc would be excellent. For the "hard science" end of my project, I would like to preform some sort of slope analysis to see what trends are occuring, as well as a conditions analysis. Its all pretty cool stuff though, and the ball is just beginning to roll on the project. Thanks again to all of you for helping me out with the links and articles.
the-one-track-mind Originally Posted by DoWork
-
01-28-2009, 02:48 PM #19
Session Cat
- Join Date
- Jan 2009
- Location
- 907
- Posts
- 16,637
IMHO, GIS needs to be a major tool of snow science. While much effort is devoted to the micro aspects of pits, lemons, fracture propagation, etc - a thorough GIS dataset can reveal macro trends that will answer many many empirical questions and aid prediction.
To this end, a comprehensive yet inexpensive and empiric standard of data collection needs to evolve.
GIS has the power to commensurate widely disparate data and represent it in a way that that makes many things very clear. Snow science can only benefit from a rigorous application of GIS.
Here's a classic example of inspired mapmaking. 7 statistical parameters explained with the absolute minimum amount of ink. Even though it's in French, it tells Napoleon's Russian story better than I ever could in English.
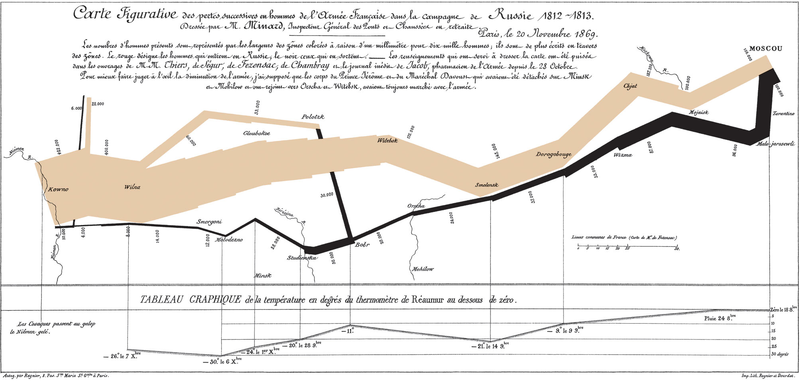
full size:
http://upload.wikimedia.org/wikipedi.../29/Minard.png
Look how he lost 32,000 men crossing the Berezinia River at -20 below...Last edited by highangle; 01-28-2009 at 02:59 PM.
-
01-28-2009, 04:30 PM #20
MWHC
- Join Date
- Nov 2008
- Location
- the hysterical town of George, CO
- Posts
- 1,676
So then you're telling me that I could make a case for going to grad school for free and possibly maybe even getting paid to do it.... Originally Posted by highangle
 the-one-track-mind Originally Posted by DoWork
-
01-28-2009, 04:51 PM #21
Session Cat
- Join Date
- Jan 2009
- Location
- 907
- Posts
- 16,637
I like the way you think. Originally Posted by pbourdon

-
01-28-2009, 05:15 PM #22
MWHC
- Join Date
- Nov 2008
- Location
- the hysterical town of George, CO
- Posts
- 1,676
Yeah, I mean come on, field work for such a project consists of BC touring/ski area riding to collect spatial data via a GPS. Then the other work is hangin' out in the lab working on GIS.....doesn't sound like a bad gig to me.
the-one-track-mind Originally Posted by DoWork
-
01-28-2009, 06:10 PM #23
Session Cat
- Join Date
- Jan 2009
- Location
- 907
- Posts
- 16,637
a helicopter could significantly enhance the efficiency of a single observer as well...
-
01-28-2009, 06:23 PM #24
MWHC
- Join Date
- Nov 2008
- Location
- the hysterical town of George, CO
- Posts
- 1,676
^^^Now you're talkin'.....
Hmm....
Dear University of Alaska Anchorage....It has recently come to my attention that a severe deficiency exists in the discipline of snow sciences...................with the Chugach experiencing more and more backcountry travel each year.............for my project I would need access to a helicopter, an experienced local guide, and my own lab based in Valdez...............
Sincerely,
pbourdon
I mean what's the point in dreaming if you're not gonna dream big right?
the-one-track-mind Originally Posted by DoWork
-
01-28-2009, 06:47 PM #25
Session Cat
- Join Date
- Jan 2009
- Location
- 907
- Posts
- 16,637
get a faculty sponsor and publish a technical paper as an undergrad
you'll get lots of heli time then, as well as your choice of grad schools


 Reply With Quote
Bookmarks